

SAMHSA list, checked November 16, 2026
How far is treatment from each Oklahoma county?
From the middle of every one of the 77 counties in Oklahoma, we measured the miles to whichever detox, live-in program and medicine clinic sits closest. 1,283,699 people live in 50 counties where the closest detox is over 30 miles away. In 23 counties, there's no treatment site of any kind.
Before you call, have two things on the table: the insurance card and the ZIP code. Yours, or the card of the person you're helping. Dialing it reaches a paid referral line, staffed by a partner and not by any program here.
All 77 counties
Rows follow the distance to each county's nearest detox. Miles here are as the crow flies; on the road it's farther.
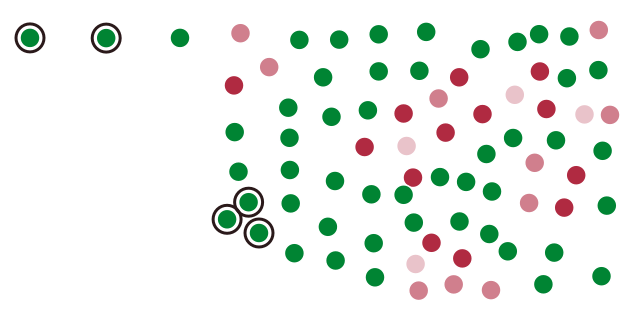
- up to 10 mi 4
- 10–20 mi 10
- 20–30 mi 13
- over 30 mi 50
- Farthest: Cimarron 164 mi, Harmon 127 mi, Jackson 119 mi, Greer 113 mi, Texas 107 mi
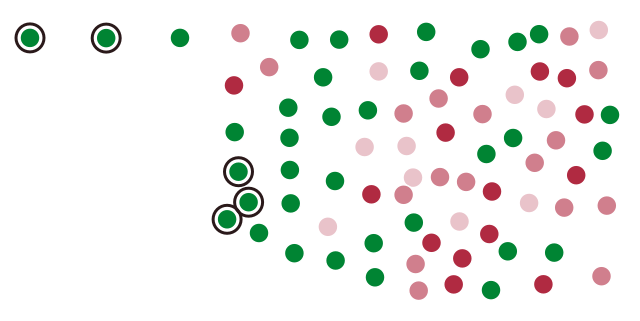
- up to 10 mi 10
- 10–20 mi 17
- 20–30 mi 15
- over 30 mi 35
- Farthest: Cimarron 164 mi, Texas 107 mi, Beckham 82 mi, Harmon 82 mi, Greer 66 mi
| County | Population 2024 | Facilities there | Detox, mi | Residential, mi | MAT, mi |
|---|---|---|---|---|---|
| Cimarron County | 2,133 | 0 | 163.7 | 163.7 | 57.9 |
| Harmon County | 2,315 | 0 | 127.2 | 81.6 | 51.3 |
| Jackson County | 24,541 | 0 | 119.4 | 57.9 | 56.5 |
| Greer County | 5,433 | 0 | 113.3 | 66.5 | 33.6 |
| Texas County | 20,577 | 1 | 106.6 | 106.6 | 3.7 |
| Tillman County | 6,736 | 0 | 101.7 | 38.9 | 33.5 |
| Beckham County | 22,248 | 1 | 90.3 | 81.6 | 17.1 |
| Kiowa County | 8,257 | 1 | 87.0 | 35.1 | 39.6 |
| McCurtain County | 30,805 | 3 | 85.8 | 16.0 | 16.5 |
| Grant County | 4,123 | 0 | 80.7 | 27.7 | 27.0 |
| Washita County | 10,839 | 0 | 79.2 | 50.8 | 25.8 |
| Comanche County | 121,396 | 2 | 75.5 | 6.2 | 6.1 |
| Custer County | 28,266 | 2 | 71.7 | 64.2 | 20.3 |
| Alfalfa County | 5,712 | 0 | 70.1 | 34.2 | 32.0 |
| Cotton County | 5,503 | 0 | 69.4 | 30.5 | 21.0 |
| Kay County | 43,437 | 4 | 62.0 | 49.9 | 5.8 |
| Roger Mills County | 3,304 | 0 | 60.5 | 60.5 | 26.6 |
| Major County | 7,569 | 1 | 60.0 | 37.6 | 4.0 |
| Seminole County | 23,351 | 3 | 55.7 | 12.4 | 26.1 |
| Garfield County | 62,007 | 3 | 55.6 | 4.8 | 5.3 |
| Le Flore County | 49,854 | 3 | 54.9 | 11.8 | 24.3 |
| Choctaw County | 14,174 | 2 | 54.7 | 26.5 | 44.7 |
| Pushmataha County | 10,800 | 1 | 54.1 | 31.4 | 32.2 |
| Blaine County | 8,573 | 1 | 53.1 | 40.6 | 26.3 |
| Beaver County | 5,025 | 0 | 51.9 | 51.9 | 51.9 |
| Dewey County | 4,268 | 0 | 51.6 | 51.6 | 35.9 |
| Caddo County | 26,337 | 1 | 49.0 | 30.2 | 9.9 |
| Nowata County | 9,561 | 2 | 47.3 | 41.0 | 20.7 |
| Pontotoc County | 38,310 | 4 | 45.8 | 5.3 | 3.7 |
| Stephens County | 44,075 | 0 | 44.4 | 35.8 | 32.4 |
| Coal County | 5,414 | 0 | 42.3 | 23.9 | 23.9 |
| Okfuskee County | 11,364 | 0 | 42.3 | 37.2 | 42.3 |
| Osage County | 46,495 | 4 | 40.9 | 37.8 | 22.3 |
| Woods County | 8,582 | 1 | 40.7 | 40.7 | 35.6 |
| Noble County | 10,896 | 1 | 39.3 | 35.4 | 19.3 |
| Jefferson County | 5,374 | 0 | 38.9 | 42.3 | 38.9 |
| Atoka County | 14,600 | 1 | 38.4 | 40.8 | 38.4 |
| Pottawatomie County | 74,446 | 5 | 37.9 | 11.3 | 20.4 |
| Washington County | 54,060 | 0 | 37.6 | 39.6 | 5.5 |
| Garvin County | 26,149 | 1 | 37.2 | 33.9 | 36.4 |
| Hughes County | 13,371 | 2 | 36.3 | 28.6 | 28.6 |
| Grady County | 58,353 | 1 | 36.2 | 29.6 | 20.6 |
| Delaware County | 41,771 | 8 | 34.5 | 11.1 | 13.0 |
| McClain County | 48,434 | 0 | 33.4 | 14.4 | 26.5 |
| Craig County | 14,506 | 2 | 33.1 | 19.3 | 22.6 |
| Kingfisher County | 15,820 | 1 | 33.1 | 30.7 | 6.1 |
| Okmulgee County | 37,084 | 1 | 32.7 | 32.0 | 27.1 |
| Sequoyah County | 40,555 | 5 | 31.6 | 31.6 | 2.9 |
| Mayes County | 40,144 | 1 | 30.1 | 25.2 | 25.0 |
| Muskogee County | 66,752 | 7 | 30.1 | 10.3 | 23.6 |
| Haskell County | 11,811 | 2 | 29.4 | 29.4 | 24.7 |
| Latimer County | 9,509 | 3 | 26.9 | 12.7 | 12.7 |
| Ellis County | 3,601 | 1 | 26.1 | 26.1 | 24.7 |
| Rogers County | 101,371 | 1 | 24.5 | 23.1 | 24.5 |
| Wagoner County | 91,257 | 3 | 24.1 | 6.8 | 8.2 |
| Pawnee County | 16,111 | 1 | 23.5 | 23.5 | 12.4 |
| Johnston County | 10,293 | 0 | 23.3 | 27.4 | 23.3 |
| Cleveland County | 303,952 | 7 | 23.2 | 5.9 | 16.1 |
| Logan County | 53,860 | 1 | 22.0 | 18.8 | 18.8 |
| Murray County | 13,754 | 0 | 21.4 | 21.7 | 20.4 |
| Canadian County | 181,760 | 3 | 21.1 | 6.8 | 6.6 |
| Creek County | 73,971 | 2 | 21.0 | 19.9 | 21.0 |
| Lincoln County | 34,972 | 1 | 20.4 | 20.4 | 19.0 |
| Woodward County | 19,991 | 1 | 19.5 | 19.5 | 6.6 |
| Adair County | 19,821 | 3 | 19.1 | 41.7 | 5.5 |
| Pittsburg County | 43,395 | 4 | 16.7 | 0.6 | 1.1 |
| Harper County | 3,209 | 0 | 16.4 | 16.4 | 16.4 |
| Love County | 10,423 | 0 | 16.4 | 16.9 | 16.4 |
| McIntosh County | 19,710 | 4 | 16.0 | 16.0 | 32.0 |
| Marshall County | 16,147 | 0 | 15.1 | 21.6 | 15.1 |
| Payne County | 84,199 | 3 | 14.6 | 14.6 | 6.7 |
| Bryan County | 50,305 | 3 | 14.2 | 50.1 | 14.2 |
| Ottawa County | 30,404 | 5 | 10.4 | 4.9 | 6.2 |
| Carter County | 49,135 | 3 | 8.4 | 11.9 | 8.4 |
| Oklahoma County | 816,490 | 30 | 7.4 | 6.1 | 5.9 |
| Cherokee County | 48,729 | 4 | 0.8 | 22.5 | 0.8 |
| Tulsa County | 693,514 | 19 | 0.8 | 2.0 | 0.8 |
Where do you even start?
Still unsure which program suits you? Ring any listed program straight away, or try the referral line just below.
Dialing it reaches a paid referral line, staffed by a partner and not by any program here.
Method
Facilities: all Oklahoma listings in SAMHSA's FindTreatment.gov that show detox or substance use treatment (November 16, 2026 snapshot). County centers: taken from the U.S. Census Bureau's 2024 Gazetteer. Population: the Census Bureau's 2024 estimates. Each facility goes into the county its ZIP code falls in (Census ZCTA to county file). Each distance is in great-circle miles, measured from the county's internal point out to the coordinates the facility lists; when SAMHSA has no coordinates for a listing, the Census Geocoder places it by its address, and if no street is published, it sits at the center of its ZIP code. Certified opioid treatment programs (OTP) are counted under MAT, medication-assisted treatment. You're welcome to reuse the data; just link back to this page.